Lifestyle
Map Shows Which States Use the Most Water
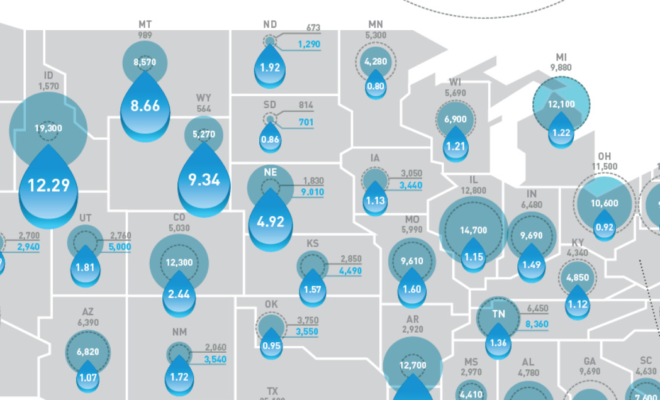
Home Advisor created an incredible infographic that shows how much water each state in America uses. They hope to shine a light on how much water is still wasted despite the increasing awareness and encouragement to live an environmentally-friendly life.
They used information from the U.S. Geological Survey’s National Water-Use Information program who compiles data “in cooperation with local, State, and Federal environmental agencies” to reflect water use every five years “at the county, state, and national levels.”
In order to make their infographic understandable and visually interesting, Home Advisor decided to focus on “a breakdown of water usage and withdrawals by state and most population county per state in the categories of domestic per capita use, industrial, irrigation, livestock, aquaculture and thermoelectric.”
Texas came in second with the largest amount of water use to California. It’s reported that 93.87 millions of gallons of water are used per day throughout industrial sites, and Harris County domestic water use per capita is 82 gallons per day. This number adds up substantially in a population of over 4 million people.
Check out the graphic below to find out more information on water use in America. How does your state rank according to the map?


